Heads up!
Your official lab manual and Canvas rubric are the source of truth for deliverables and grading. Use this page to prepare faster, work smoother, and avoid the classic mistakes.
Quick reminder before you write that lab report:
- This site is public. If you found it, so can plagiarism checkers.
- Screenshotting a LaTeX derivation or re-typing it word for word is still copying.
- The whole point of these notes is that you understand the steps. If you can re-derive it without looking, you’re safe. If you can’t, you’re not ready to write it yet.
- “An Aggie does not lie, cheat or steal.” Your report should sound like you.
Overview
Your first lab has one big idea behind it: no measurement is ever exact. Every number you record carries an uncertainty, and when you combine measurements in a calculation, those uncertainties combine too. This lab teaches you to quantify that.
In this lab, your team will use a camera to track three stickers situated on three corners of the square plywood. Based on the coordinates of three stickers, you will use basic geometry to figure out the length and width of the moving square, then its area, frame by frame.
Before Lab
Concepts you need
Uncertainty the ”± something” attached to every measurement. It comes from two places:
- Systematic error: something consistently off (e.g., a camera calibration issue). Repeating measurements does not fix this.
- Random error: natural scatter between readings. Repeating measurements does shrink its effect.
Reporting a repeated measurement when you take readings of the same quantity:
The uncertainty of your average (, the standard error) gets smaller as you collect more data — this is why the manual tells you to collect a large data set.
Theory in practice
Excel and Google Sheet have a Standard Deviation function so you don’t have to manually calculate it.
Propagation of error for multiplication for an area :
Relative uncertainties add in quadrature. Memorize the shape of this formula — it comes back all semester.
Know before you walk in
- You’ll measure length and width by placing three stickers on three corners of the square. Length and width each come from the distance between a pair of sticker positions.
- Distance between two tracked points and :
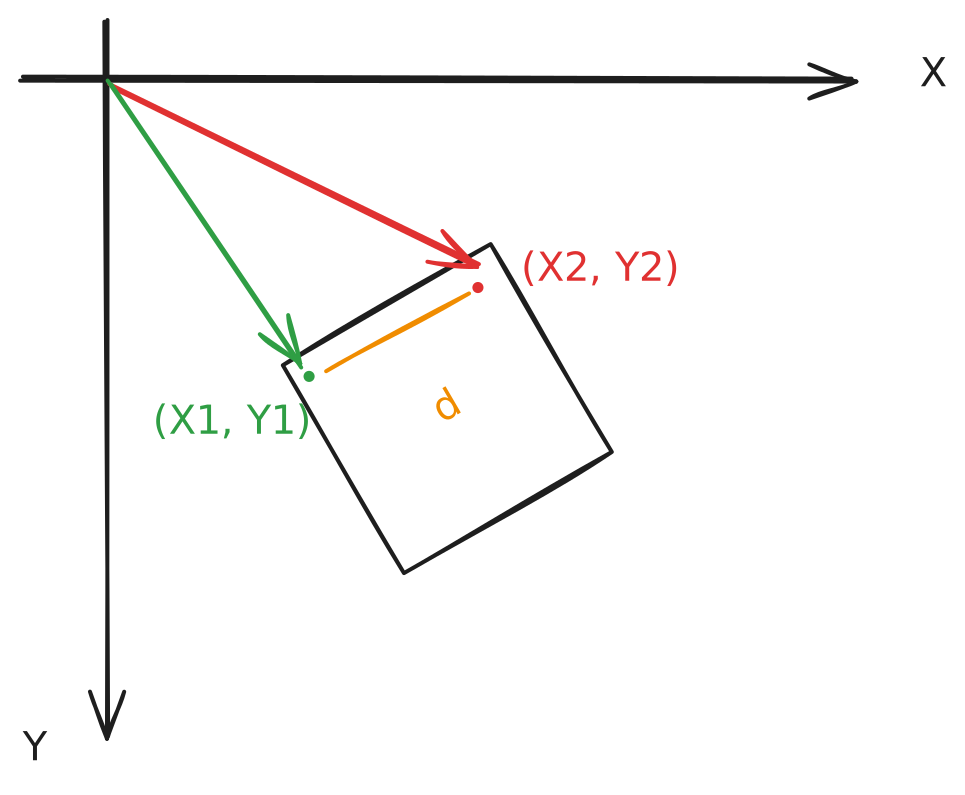
- Everything stays in pixel units for this lab. That’s intentional, don’t convert to cm.
- Skim your report template now, not the night before. 10% of the grade is just following it.
During Lab
Linux Commands Cheatsheat
Common commands such as connecting to Jetson and working with files are outline in Getting Started with ENGR 216.
Commands you’ll use
The very first thing you should do once you are connected with Jetson is copying the file out of its original directory.
cp examples/tracking/4_track_and_print_with_camera_input.py ~Once you have the file out, you can run the Python script by:
python3 4_track_and_print_with_camera_input.pyYou should see the camera feed pops up on the screen. If you run into a problem, you may refer to Troubleshooting section, or ask a PT for help. Once the script has been running for around 30 seconds and you should have enough data points, turn off the camera by ⌃ Ctrl + C.
The script outputs a .csv file. The columns you care about for this lab are position px x-<color> and position px y-<color> for each sticker. Columns like rx, vx, ax belong to a later lab and should be empty.
Procedure tips
- Watch the camera feed for flickering. If any of the colors are not always tracked, this means your table does not have enough lighting. Please look for a PT when this happens.
- Move the square between readings. The manual asks for this explicitly; it’s what makes your data set capture real random variation.
Troubleshooting
| Symptom | Likely cause | Fix |
|---|---|---|
| Cannot connect with Jetson | Cable unplugged / loose | Unplug then plug in again. If problem prevails, ask a PT to change the cable. |
| Cannot connect with Jetson (MacOS) | Port not recognized | Change the to a different USB port and open a new terminal to connect. |
| Camera not detected | Cable unplugged / loose | Look for the USB connection between the camera and the table. Disconnect then connect again. |
| A sticker isn’t tracked or flickering tracking | Duplicate color, glare, not enough ligting, or sticker out of frame | Swap to an unused color; reposition to reduce glare; check the camera’s view; use an additional flashlight |
| Laggy video feed | Resource exhaustion | Restarting the camera by unplugging, or restarting Jetson. This is a slow process, ask a PT to move to an empty table. |
Permission denied when script writes output | You’re running from the examples directory (write-protected) | Copy the script to your own folder first, run it there |
python3: command not found or script won’t run | Wrong directory or typo in filename | ls to confirm you’re in the right folder; tab-complete the filename |
| CSV is missing position columns | Sticker never detected during recording | Fix tracking, record again |
Before you leave the lab
- Data set is large (hundreds of frames, not dozens) and the square was moved during collection
- CSV opens and the position columns are populated for all three stickers
- Every teammate has a copy of the lab data
- Have a PT check your length and width distribution graph
- You can explain, in one sentence, how length and width will be computed from the sticker positions. You’ll need to write exactly that in the report.
After Lab
What the deliverables are really testing
The manual asks for area calculated two different ways, and this trips people up. Here’s the point of each:
- Propagated area — average your lengths, average your widths, multiply, and push the uncertainties through the propagation formula. Tests whether you can predict the uncertainty of a derived quantity.
- Statistical area — compute an area for every single reading, then take the mean and standard error of that list of areas. Tests whether you can measure uncertainty empirically.
If your two results agree within their uncertainties, that’s a strong sign your analysis is sound — and comparing them makes an excellent discussion point in your report.
Analysis checklist
- Compute , , and their uncertainties from your data
- Make histograms for length and width (Google Sheets or matplotlib both work — the manual shows how)
- Report results in a table: Width, Length, Area (propagated), Area (statistical), each with its uncertainty
- Units on everything: px for lengths, px² for areas
Common mistakes that cost points
- Missing or wrong units — pixel² for area, not pixels
- Uncertainty with too many digits — round uncertainty to 1–2 significant figures, then match your value’s decimal place to it (e.g., px, not px)
- Histograms without axis labels — label the axis and include units
- Skipping the method description — 20% of the grade is explaining how you got length and width from pixel positions. Write it so a student who wasn’t there could repeat it.
- Ignoring the report template — it’s the easiest 10% you’ll ever earn or lose
Up next
Now that you understand the fundamentals of error in measurements and handling them in your calculations, your team will integrate those background into calculating the local gravitational acceleration.
Your next stop